1. General pursuit of nonlinearity
Press the button 'Toggle code' below to toggle code on and off for entire this presentation.
In [2]:
from IPython.display import display
from IPython.display import HTML
import IPython.core.display as di # Example: di.display_html('<h3>%s:</h3>' % str, raw=True)
# This line will hide code by default when the notebook is eåxported as HTML
di.display_html('<script>jQuery(function() {if (jQuery("body.notebook_app").length == 0) { jQuery(".input_area").toggle(); jQuery(".prompt").toggle();}});</script>', raw=True)
# This line will add a button to toggle visibility of code blocks, for use with the HTML export version
di.display_html('''<button onclick="jQuery('.input_area').toggle(); jQuery('.prompt').toggle();">Toggle code</button>''', raw=True)
- We have seen how we can inject nonlinear functions into supervised/unsupervised
- In general we cannot determine what sort of nonliearity to use for a given dataset
- So we try various combinations of different generic nonlinear functions, and see which combination works best
- We need to be organized and discipline in this search
- Simply taking random combinations of various functions does not allow for effecient computation or fine-tuning of nonlinearity
- Conversely if we retrict ourselves to using a set of related functions we can better manage, optimize, and perform the task
Example 1. A combination of very different functions is difficult to use
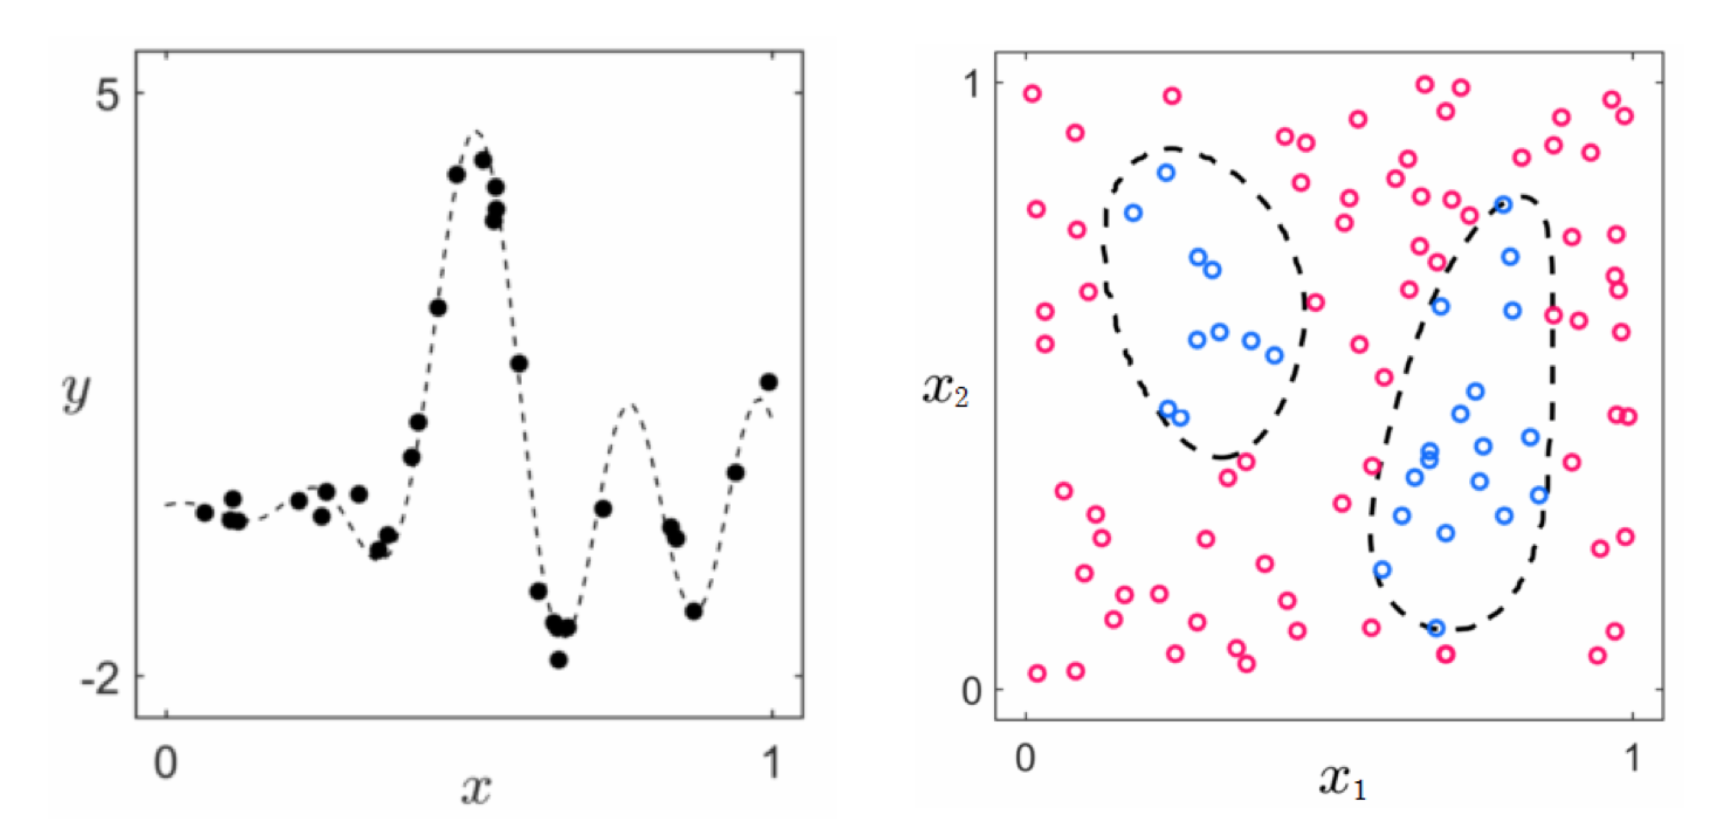
- Suppose we have a regression dataset where we cannot guess (via visualization or intuition) a good nonlinearity
- We use a familiar toy data below to simulate our task of searching over various combinations of nonlinear functions to find a fitting nonlinear representation for the data
In [8]:
# create instance of linear regression demo, used below and in the next examples
csvname = datapath + 'noisy_sin_sample.csv'
demo1 = nonlib.demos_part_2.Visualizer(csvname)
demo1.show_pts()

- Say we limit ourselves to trying linear combinations of the following three functions
In [9]:
# plot our features
demo1.plot_feats(version = 1)

- We first try
- then
- and finally
In [11]:
# show first round of fits
demo1.show_fits(version = 1)

- Here the third function is wildly different than the first two, we are unable to control gradual change in nonlinearity
- Now lets try same experiment but with all three functions related --> polynomials
In [ ]:
# plot our features
demo1.plot_feats(version = 2)
In [ ]:
# show first round of fits
demo1.show_fits(version = 2)
- We get a better fit of course, but the change in nonlinearity is more gradual, predictable, and controllable
The three standard species of functions used for prediction
- We could try adding various random functions for our nonlinear predictor e.g.,
- But to make computationally effecient search methods we need to be more organized than this
- Hence in practice we typically stick to combining functions from a single species - or collection of similar behaving functions
- We use $B$ functions from such a species, making a
modelfunction of the form
- By adding together such functions we can create any sort of non-linearity we want, easier to control and optimize
- At a high level: three main types of species used in practice - kernels, neural networks, and trees
- Inside each catalog there are many sub-species, here we introduce each species via a simple but common example from each
- We will then circle back to discuss more complex sub-species of neural networks
1. Kernels
- Basic example: polynomials
In [12]:
# import Draw_Bases class for visualizing various basis element types
demo = nonlib.DrawBases.Visualizer()
# plot the first 4 elements of the polynomial basis
demo.show_1d_poly()

In [11]:
demo = nonlib.regression_basis_single.Visualizer()
csvname = datapath + 'noisy_sin_sample.csv'
demo.load_data(csvname)
demo.brows_single_fit(basis='poly',num_units = [v for v in range(1,15)])
Out[11]:
- For two inputs - $x_1$ and $x_2$ - the catalog of polynomial elements looks like
- In general a degree $D$ element takes the form
where where $p$ and $q$ are nonnegative integers and $p + q \leq D$
In [ ]:
demo.show_2d_poly()
In [5]:
demo = nonlib.regression_basis_comparison_3d.Visualizer()
csvname = datapath + '3d_noisy_sin_sample.csv'
demo.load_data(csvname)
demo.brows_single_fits(num_elements = [v for v in range(1,10)] ,view = [20,110],basis = 'poly')
Out[5]:
- Can be defined likewise for general $N$ input dimension
- General attributes of kernel bases:
- classic examples also include: Fourier and cosine bases, radial basis functions
- each element has a fixed shape (no internal parameters), elements are ordered from simple to complex
- always leads to convex cost functions for regression / classification
- great for medium sized problems, but many varieties have serious scaling issues when $N$ and $P$ are large
- often used with support vector machines (for historical reasons)
2. Neural networks
- Basic example: single hidden layer network with tanh activation
- Internal parameters make each function flexible
- e.g., take $f_1$ with various internal parameter settings
In [12]:
# import Draw_Bases class for visualizing various basis element types
demo = nonlib.DrawBases.Visualizer()
# plot the first 4 elements of the polynomial basis
demo.show_1d_net(num_layers = 1,activation = 'tanh')

- Basic example: single hidden layer network with relu activation
- Internal parameters make each function flexible
In [13]:
# import Draw_Bases class for visualizing various basis element types
demo = nonlib.DrawBases.Visualizer()
# plot the first 4 elements of the polynomial basis
demo.show_1d_net(num_layers = 1,activation = 'relu')

In [15]:
demo = nonlib.regression_basis_single.Visualizer()
csvname = datapath + 'noisy_sin_sample.csv'
demo.load_data(csvname)
demo.brows_single_fit(basis='tanh',num_units = [v for v in range(1,15)])
Out[15]:
- For two inputs - $x_1$ and $x_2$ - the catalog of single layer functions with relu activation
- or likewise
In [19]:
demo = nonlib.regression_basis_comparison_3d.Visualizer()
csvname = datapath + '3d_noisy_sin_sample.csv'
demo.load_data(csvname)
demo.brows_single_fits(num_units = [v for v in range(1,12)] ,view = [20,110],basis = 'net')
Out[19]:
- Generalizes to $N$ dimensional input
- General attributes of neural network bases:
- elements are of the same general type, each has adjustable shape (with internal parameters)
- leads to non-convex cost functions for regression / classification
- especially great for large high dimensional input problems
- often used with logistic regression (for historical reasons)
3. Trees
- Basic example: depth-1 tree, also known as a stump
- Vocab: for $f_j$ the value $V_j$ called a split point, $a_j$ and $b_j$ called levels
In [ ]:
# import Draw_Bases class for visualizing various basis element types
demo = nonlib.DrawBases.Visualizer()
# plot the first 4 elements of the polynomial basis
demo.show_1d_tree(depth = 1)
- Split points and levels set directly using data, not internal parameters
- e.g., a split point placed between two inputs, left / right level set to average of output to the left / right
In [20]:
demo = nonlib.stump_visualizer_2d.Visualizer()
csvname = datapath + 'noisy_sin_raised.csv'
demo.load_data(csvname)
demo.browse_stumps()
Out[20]:
In [21]:
demo = nonlib.regression_basis_single.Visualizer()
csvname = datapath + 'noisy_sin_sample.csv'
demo.load_data(csvname)
demo.brows_single_fit(basis='tree',num_elements = [v for v in range(1,10)])
Out[21]:
In [22]:
demo = nonlib.regression_basis_comparison_3d.Visualizer()
csvname = datapath + '3d_noisy_sin_sample.csv'
demo.load_data(csvname)
demo.brows_single_fits(num_elements = [v for v in range(1,20)] ,view = [20,110],basis = 'tree')
Out[22]:
- Generalizes to $N$ dimensional input (split points / levels in each individual dimension)
- General attributes of tree bases:
- each element is adjustable, with internal parameters pre-set greedily to data
- leads to convex cost functions for regression / classification, trained via boosting (greedy coordinate descent)
- great for large sparse datasets
How many elements to choose?
- The more elements we use the better we fit our data (provided we optimize correctly)
- This is good in theory, but not in practice
- In theory -with infinite clean data and ininite computation - the more elements (of any basis) --> better fit / separation
- In fact: in such an instance all three catalogues equal, and can perfectly represent / separate
In [7]:
demo = nonlib.regression_basis_comparison_2d.Visualizer()
csvname = datapath + 'sin_function.csv'
demo.load_data(csvname)
demo.brows_fits(num_elements = [v for v in range(1,50,1)])
Out[7]:
- With real data however more elements $\neq$ better fit
In [5]:
demo = nonlib.regression_basis_comparison_2d.Visualizer()
csvname = datapath + 'noisy_sin_sample.csv'
demo.load_data(csvname)
demo.brows_fits(num_elements = [v for v in range(1,25)])
Out[5]:
- Nothing has 'gone wrong' here - we just do not know ahead of time how many elements is 'too little' and how many is 'too much' (in terms of nonlinearity)
- i.e., error on training set always goes down as we add elements (provided we optimize correctly)
In [25]:
demo = nonlib.regression_basis_single.Visualizer()
csvname = datapath + 'noisy_sin_sample.csv'
demo.load_data(csvname)
demo.brows_single_fit(basis='poly',num_elements = [v for v in range(1,25)])
Out[25]:
- When fit is not nonlinear enough / we use too few basis features --> call this underfitting
- When fit is too nonlinear / we use too many basis features --> call this overfitting
- The way of finding best combination of elements to use called cross-validation